
Software Architecture Consulting: Everything You Need to Know About it
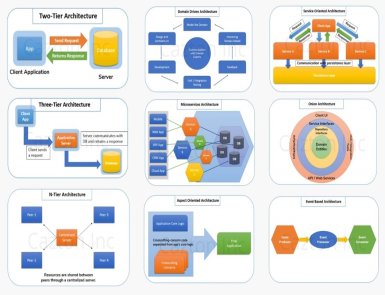
The landscape of web technology has been constantly evolving. Therefore, companies must have a robust software architecture in place. Whether you want to create a scalable application, ensure security, or optimize performance, the base of a software system revolves around its architecture. This is where the software architecture consulting services come into play. Regardless of the type of software you want to develop, you need expert guidance for its design, implementation, and optimization. And a software architect can help you with that.They help individuals develop products based on their organization’s requirements and expectations. People who want to meet the challenges of their online business can’t ignore software architecture consulting. Let’s get to know more about software architecture consultancy and its role. Who are software architects and what are their roles? A software architect is an experienced professional accountable for making the comprehensive roadmap of software projects. They work closely with developers, investors, and other team members and frame guidelines for software development. In short, they create a digital ecosystem that helps all team members to move in the right direction. Advantages of Software Architecture Consulting Services Software architecture consulting has a significant role in the success of a software development project. After all, it takes care of everything, including project design, scalability, performance, and maintenance. Let’s learn how this service ensures the success of software development. Strategy Planning You can’t expect your project to be a success until proper strategies behind it are working. Software architects work with businesses to create approaches that give them competitive edges. Architecture consultants make technology roadmaps to meet objectives. This implementation plan features a comprehensive, step-by-step guide for the development team. Consultants design the overall structure of a software system. This job includes creating modules and components. The architect consultant creates a blueprint to guide developers on how to create a fully functional software application. In addition to this, a software architect helps businesses choose the best-suited tools and technologies for software development. They assess different options, determining factors like performance, scalability, and compatibility. Optimization of Integration & Infrastructure Software architecture consultant plans integration of new tools and upgrades of existing ones. Since these consultants have years of experience in system upgrades and infrastructure optimization, they know when to make changes in the system. In addition to this, they carefully optimize the utilization of resources and response time. Software architects also keep an eye on the performance of software. They optimize it for efficiency and speed. They also try to find possible issues and make strategies to fix them. Security Security cannot take a back seat when it comes to software development. Since cyber attacks and security breaches are continuously growing, software architecture consultants prioritize software security. They identify all the possible vulnerabilities and take measures to mitigate them. In addition, they help implement encryption and authentication. Furthermore, they ensure secured access control to the software. Scalability After a period of time when the user base grows and data volume increases, scalability becomes a necessity. The scalability ensures that software can manage future growth without compromising on performance. Streamlined Development Process Software architecture consultants provide guidance throughout the development process. They work closely with the development team to streamline workflow and improve productivity. Besides, software architects help the development team to follow the standard procedure for code base maintenance. Migration Sometimes, you have to switch to a different platform. For newbies, it can be a challenging process. Nevertheless, with software architecture consultants, you get smooth migration. They choose appropriate deployment models and providers for you. Consultants determine the objectives and cost of migration. And after evaluating the environment and the relevant apps, make the best decision. Types of Software Architects Software architects have various types based on their jobs and responsibilities. Software Technical Architect Also cited as an IT system architect, a software technical architect plans, develops, and maintains IT systems for businesses. They are accountable for the implementation of particular platforms or technologies. Solution Architect Solution architects design and implement technology solutions that align with the requirements of the business. In short, these architects suggest the best software technology after analyzing the existing environment. Data Architects As the name suggests, data architects make a framework that helps businesses manage their data. Enterprise Architects Enterprise architects are responsible for adjusting the organization’s IT strategy as per the goal. They make plans for business policies, processes, and standards. My Software Architecture Consulting Service Software architecture consulting is a complete solution for companies that need to optimize their software infrastructure. They provide valuable insights customized for specific needs. Furthermore, they create a strategic roadmap that aligns with business long-term objectives. If you want to optimize your software architecture for enhanced performance, choose my software architecture consulting service. With years of experience, I can provide you with future-proof software solutions. Whether you are developing a new application from scratch or revamping the existing system, I will provide you with the strategic insights required to succeed. So what are you waiting for? Transform your software development landscape with Almas’s expert software architecture consulting service.
Redis License Update: Things You Need to Know
Are you dependent on Redis for your projects? You must keep an eye on every new update that occurs in Redis. After all, staying informed helps you make the best decision. Redis, also known as Remote Dictionary Server, is a prominent open-source, in-memory database. The database stores data as key-value pairs. Individuals use Redis as a quick-response database, message broker, or application cache. Redis has come a long way since its initial release in 2009. It has become a popular choice for web developers, thanks to its flexibility and speed. Redis keeps updating its license periodically. It affects how people can use this technology. In this post, we explore the latest updates in Redis licensing. So without any further ado, let us get started. Prominent Changes in License Earlier, Redis was being operated under the BSD 3- Clause License. However, now it is moving toward a dual-license model. It allows web developers to choose between the Redis Source Available License version 2 (RSALv2) or the Server-Side Public License version 1 (SAMPLV1). Let us get to know more about these two versions. What is RSALV2? RSALV2, also known as Redis Source Available License 2.0 is a permissive, royalty-free license provided by Redis. It permits the use, modification, and distribution of software components designed to work particularly with Redis. However, this agreement is subject to certain limitations. What is SSPLV1? SSPLV1 (Server Side Public License) is an adaptation of the GNU Affero General Public License (AGPL). If any entity offers SSPL-licensed software as a service, they will have to release the entire source code of the service. These include user interfaces, APIs, management, and automation. This dual-license model offers extensive flexibility and clarity to developers. They can determine how to use Redis technologies in their projects as per their preferences. RSALv2 is a permissive non-copyleft license. It grants users the right to copy, use, distribute, make available, and create derivative works of the software. The license has two primary limitations under RSALv2. These include: Users cannot commercialize the software or use it as a managed service for others. People cannot remove copyright or licensing. All-in-all, with the Redis 7.4 version, Redis has become dual-licensed under the RSAL v2 and SSPLv1. Now users will not be able to use Redis’s source code under the BSD 3-clause license. Nevertheless, Redis will continue to provide free and permissive use of the source code under SSPLv1 and RSALv2 licenses. Redis has jumped into the next phase of development. This real-time data platform offers a unified set of clients and various core Redis tools under Redis Community Edition. Users can now use Redis across different contexts, such as high-performance key/value, powerful query engine, and document store. Redis’ new license approach makes Redis source code widely available. It provides developers with a feature-rich platform with minimal limitations. According to Redis, its dual license approach is not new. They released Redis modules back in 2022 under dual licenses. Nevertheless, this time they have switched to dual licensing for their free available software. With this update, the company eliminates issues that have been raised by the community. Acquisition of Speed Besides making changes in the license, Redis has acquired Speedb. Speedb is a RocksDBI-compatible key-value storage engine. The engine is capable of stabilizing the performance even under the heavy load. Redis is in-memory storage. However, with this acquisition, it has improved its performance several times. The acquisition confirms Redis commitment to keep up with the latest database technology and enhance its overall capability. Impact of License Update For individuals using Redis’ open-source version or new releases (dual licenses) for personal or internal usage, there is no change. Nevertheless, companies that provide competitive offerings will not be able to use the source code of Redis for free. They are not allowed to sell source code to 3rd parties through paid support arrangements. Final Words So these were some updates of the Redis License. We hope it helps make an informed decision for your next project. Going through these updates, we can say that organizations with competitive offerings to Redis will no longer be allowed to source code free of cost. Nevertheless, you can’t overlook the improvements Redis has brought..
Why is Low-code Platform a bad choice in Development?
Low-code or no-code web development is in trend. It enables users to build applications in less time with minimal or no coding. However, these quick development facilities often come with consequences. Although they limit individuals’ dependency on web developers, low-code platforms are not always a good choice. Wondering when you should avoid these platforms? Read this post until the end. Before we proceed further, let us learn what a low-code platform is. What are Low-Code Web Development Platforms? As the name suggests, a low-code platform lets people develop websites or mobile applications with minimal coding. Since it is affordable and requires limited technical knowledge, numerous people and companies prefer to use it. Tilda, UIPath, Adalo, and Webflow are some popular low-code platforms. Unfortunately, these platforms have numerous benefits but come with some limitations. Limitations of Low-Code/No-Cod Web Development You Can’t make What Exactly You Desire With most low-code or no-code platforms, you cannot build a website/mobile application that specifically meets your requirements. They can help you make a simple landing page with limited features. However, if you want to create a complicated business application, it will be challenging to get the desired results. These platforms always come with templates that do not align with particular requirements. Compromised Security Another issue with low-code platforms is compromised security. Since cyber-attacks are increasing day by day, security is a primary concern in web development. No company wants a website or an app, which is at risk of cyber-attacks. These platforms come with pre-designed templates that might have inherent weaknesses. Hackers might exploit these vulnerabilities. When you opt for custom web development services through certified professionals, you naturally minimize security inadequacies. Furthermore, web developers can integrate powerful encryption and security protocols to ensure the security of your app/website. Limited Customization If you want to develop an application that stands out from the crowd, a low-code development service won’t be a good choice. In most cases, they have fixed templates with minimum customization options. You won’t be able to modify several aspects of your app. The lack of integration options might frustrate you in the long run. So if you have complex requirements, consider taking traditional software development services. Poor Performance Low-code/no-code web development relies on pre-built components to perform. Consequently, it might face issues like slow loading and inadequacies. These small things lead to poor user experience and bounce rate. No Proper Control Lack of control of the application is one of the biggest downsides of low-code platforms. Users have to adhere to the policies of the low-code development service providers. Sometimes, these restrictions can go against users. Since you do not have control and ownership over these low-code development services, you can’t do much about them if they suddenly increase service fees. Sometimes, they discontinue the features that are crucial for your business. No Access to Codes There are situations when you have to access the web codes of your website or application. Unfortunately, low-code platforms limit access to codes. As a result, it can be challenging to modify the application. Even if you ever migrate your app to other no-code platforms, your existing service provider might restrict access. Inconsistent Appearance The aesthetics of a website or web application is quite important. It acts as a virtual storefront for businesses. Elements, grids, colors, there are numerous aspects to take care of. With pre-build design templates, you can’t get the exact appearance you want. Final Words: Are Low-Code Web Development Platforms Worth it? Undoubtedly, low-code or no-code platforms come with a lot of compelling features. They are easy to use and affordable. Nevertheless, you can’t neglect their drawbacks. People looking for customized web solutions for their business or brand must ignore these platforms. If you are developing software or an app that requires security compliance, no-code web development options can expose you to risks. Furthermore, they don’t give you complete control over the code base. If you think only low code development can fulfill all your business requirements, you are mistaken. Beyond the simple use case, you will need to hire developers. Consequently, custom web development services are always a better choice. Of course, you spend some extra dollars, but you get a feature-rich, safe, and high-performance website or application. If you want to empower your brand and set it apart from the competition without compromising on security, choose Almas web development services. Let’s bring your vision to life with advanced web development services.
Git Branching Strategies for the Next Level Web Development

Branching strategies in Git have become crucial tools to enhance the web development experience. These approaches enable web developers to collaborate on a project while maintaining multiple versions of the primary codebase. In short, a team can work on new features independently without affecting the main codebase. A well-constructed Git strategy improves project collaboration and code deployment speeds several times. Best Git Branching Strategies In this post, we explore some top Git branching strategies, along with their pros and cons. So without any delay, let’s get started. Trunk Based Development (TBD) Trunk-based development or TBD is a version control management approach. The strategy supports a single shared branch known as the ‘trunk’. It allows developers to merge frequent updates to a core trunk (main branch). TBD lets developers create short-lived branches with a handful of small commits. Trunk-based development improves organizational performance by reformatting integration phases and merging. As a result, it helps programmers achieve continuous integration and continuous delivery. Pros TBD supports frequent integration of code changes into the main branch. As it supports automated testing, bugs are identified quickly. It provides better team collaboration. Cons Short-lived branches might hinder the ability to isolate complex features. TBD is reliant on CI/CD practices to maintain stability. Git-Flow Git-Flow is another renowned branching model for Git. It has various branch responsibilities. For example, main/master for the production, feature for new features, a hotfix for urgent bug fixes in production, develop for active development, and more. Introduced by Vincent Driessen, this branching model provides a structured approach to organizing branches. Usually, the Git-Flow strategy includes the following branches. Master This branch contains production-ready codes. Develop As the name indicates, the development branch supports ongoing development and integration of new features. Git-flow features auxiliary branches that facilitate different stages of development and release management. Pros Git Flow is suitable for a large team. Users can manage multiple product versions impeccably. It provides clear responsibility for each branch. Users can navigate to different production versions via tags. Cons Due to multiple branches, some users might find it complex. Since the branch supports multi-step processes, development, and release frequency may become slow. GitHub Flow GitHub Flow is one of the lightweight and straightforward Git branching strategies. Suitable for limited-sized teams and projects, the strategy supports quick bug-fixing. Furthermore, it has numerous other exciting features. GitHub Flow is used with GitHub, which is a popular hosting service for Git repositories. It keeps the main branch deployable all the time. The workflow of GitHub Flow utilizes two branches. These include: Main The GitHub Flow workflow starts with the main branch containing the newest stable code that is ready for release. Feature Web developers can create feature branches from the main branch. These branches allow them to work on new features. The feature branch gets merged into the main branch after the completion of the feature. As soon as the merge is complete, developers remove the feature branch. It helps them keep the repository organized and clean. Pros GitHub Flow is easy to learn and use. Even beginners can employ it. It supports quick feedback loops by enabling developers to merge their changes into the main branch before releasing them. GitHub Flow is flexible enough to meet the requirements of different teams. Teams can utilize feature flags to manage new features released to production. Cons GitHub Flow might be challenging to manage in complex projects. Coordinating merges and keeping the main branch stable can be difficult. GitLab Flow If you are looking for a powerful Git branching strategy that can be scaled as per the requirements, GitLab Flow is an ideal choice. The branching strategy is designed for developers who use GitLab repository manager. It makes the development process straightforward by focusing on a single, protected branch, usually the main branch. The GitLab Flow workflow has the following four branches. Main This primary branch comprises the latest stable code ready for release. Develop The GitLab Flow’s workflow begins with the develop branch. This branch holds bug fixes and new features. Features The branch allows developers to form feature branches straight from the develop branch to work on new features. Release Before every new release, a release branch is formed using the develop branch. This branch helps users stage the new features and fix bugs for the release. Later on, developers merge the release branch into the develop and main branches. Pros GitLab Flow is powerful and easy to scale. You get a clear code separation from production-ready code. For each feature, you get an independent feature development. Separate branches let users work together on different features. Cons Merging the feature branches into the develop branch might cause conflicts sometimes. Beginners might find this strategy a bit complicated. Conclusion So these are some of the best Git branching strategies. We explained their uses along with their strengths and weaknesses. Now you can make an informed decision. Choose the one that better aligns with your release approach, project type, collaboration requirement, and team size.
How Much It Costs to Build a Minimum Viable Product (MVP)
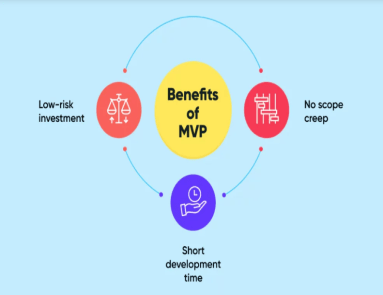
Today businesses and startups keep introducing new products to capture the market share. They take a Minimum Viable Product (MVP) approach to launch their web applications. After all, releasing the simple version of an app lets you test it better. Nevertheless, how much does it cost to create an MVP? Numerous startups have this question in their minds. In this post, we learn about the factors that influence the price of MVP. It will give you an idea about the budget you should arrange for your next MVP. So without any further delay, let’s start it. Factors Affecting the Price of Building a Minimum Viable Product Building an MVP is comparatively more affordable than an actual product. Furthermore, it helps you set budget expectations and secure funding. In short, you can create a clear financial plan for your project. Let’s discuss the aspects that may affect the cost of an MVP. Features of MVP The features and complexity of your MVP play a crucial role in determining the overall cost. If you are making a simple pilot product with basic features and functionality, the cost will be low. The web application with complex features, data processing, and API integrations requires a substantial budget. UI/UX Design User Interface and User Experience also influence the cost of an MVP to a great extent. UI and UX determine how your target audience interacts with your product. If your application’s visual appeal and functionality cannot retain users, you can’t expect to get the desired results. As a result, you must allocate some budget, particularly for UI/UX design. If your product/web application requires comprehensive wireframing and prototyping, it will naturally increase the overall price. Software & Web Technologies The type of programming languages, libraries, and frameworks you use also affects the price. Besides this, the license fee for software pieces increases the product cost. If you want to do cost-cutting in this part, choose cross-platform frameworks rather than native technologies. Nevertheless, do not compromise on the functionality and scalability requirements of the app. Cost to Hire a Development Team The cost of hiring a web development team depends on various factors. We have listed some of them below: Team Size The number of members a development team has affects the cost. If you need a large team, you will have to pay accordingly. Experience Besides the size of the team, expertise and experience level of developers also influence the cost. A skilled and experienced professional often has a higher fee than a newbie. If you also need testers or data engineers, the project cost will rise. Location of the Team Web developers from the United States and Europe may charge more than programmers from Asia. So consider the geographical location of experts when hiring them. In addition to this, you may also determine choosing between freelancers and an in-house team. Do not forget that getting an on-site team entails additional expenses apart from their salary. Overall Development Timeframe of the Product How long it would take to develop a minimum viable product depends on various factors. The number of programmers, availability of resources, and complexity of the applications are a few common aspects. Besides, numerous technological challenges can impact the timeframe. The shorter the timeframe for building an MVP is, the more cost-effective it will be. The Possible Hidden Charges for Building an MVP In addition to the above evident expenses, you may have to bear some unforeseen expenses. These could be: Quality Testing Once your MVP is built, it is tested for proper functionality and a pleasing user experience. You will have to hire a vendor to obtain a QA testing service and certification. Performance Optimization As your user base increases, you will need to scale and optimize the performance of your MVP. For example, you might need to invest in a high-capacity hosting server, load balancers, and caching tools. Integration of 3rd Party Services In some cases, your application may require third-party integration. It can be an API, Plugin, or any external platform. These services can have monthly fees or license costs. Local and International Marketing Determine whether you want to target the global or local market. Depending on your target audience, make your application compatible with a particular language. These small things also impact the cost of the product. Maintenance Even after your application is officially launched, it requires regular improvement and maintenance. The cost of maintenance might go up to 20% of the overall MVP development cost per year. Marketing Your product cannot succeed if it does not reach the right audience. Therefore, you need to spend on marketing techniques too. You will have to create a budget for social media advertising, content marketing, and search engine optimization. Quick Tips to Minimize the Cost of an MVP Go for web application-building platforms that require minimal coding. Use open-source libraries & frameworks to avoid license fees. For instance, React Native and Flutter are two open-source frameworks that you can use to build iOS & Android-based mobile applications. To manage the scalability requirements of your app, prefer cloud-based development platforms like AWS and Azure. Consider outsourcing your MVP app development. It will be several times cheaper than hiring an in-house team. Final Words Building an MVP is an ideal way to bring an idea to life. Nevertheless, before you progress, you must be aware of potential expenditures. In this blog, we make you familiar with all the factors that can increase the cost of your products or app. Based on these aspects, you can plan the budget for your MVP. If you want to know the exact price for an MVP, get in touch with Almas. Our web development consultant will do a detailed cost analysis of your desired MVP based on your requirements. Besides web development consulting, we also provide web development services. So what are you waiting for? Take the first step toward your
Why Consider Hiring a Web Development Consultant in 2024

Are you planning to establish an online presence in 2024? Great going! Gaining success online is not a matter of chance. It requires proper strategies and implementation of relevant technologies. In the ever-evolving landscape of technology, you cannot rely on conventional and fixed approaches to grow. You need a web development consultant who can guide you with their expertise and experience. This post explains why one should consider hiring web development consultants. Without any further delay, let us get started. Web Development Consultancy Overview A web development consultant is an expert who gives advice and support in planning, developing, and maintaining websites and applications. The consultant helps you throughout the journey of making a concept into reality. They not only streamline the web development process but also improve the visibility of your website. In short, web consultants enable you to reach your target audience. Let us understand what exactly a web development consultant does. What Services do Web Development Consultants Offer? Generally, a web development consultancy assists businesses in creating, improving, and maintaining their web presence. Depending on your requirements, they create a strategy to develop your website from scratch or revamp the current one. Individuals can seek consultancy for website development, E-commerce websites, CMS (Content Management Systems), software development, and more. In addition to this, they also help you with website design, performance optimization, SEO, website security, and maintenance. If we discuss the process for web development consultancy, it goes like this: Initial Consultation The initial consultation involves meeting with a client and understanding their business goals. In this process, a consultant tries to identify your target audience, scope of work, and budget. Planning of Project After the initial discussion, the consultant does comprehensive project planning based on objectives. It includes making project timelines and milestones. After that, the expert determines the framework, tools, and expertise required. Designing Phase In this phase, web development consultants guide you in developing the structure and layout of the website. They give expert advice on design elements like UI and UX. They can also prepare website navigation paths and UX content strategies. Development An experienced consultant chooses the most suitable website development platform for your website. They also mentor you for the integration of 3rd party tools. Maintenance Web development consultants offer ongoing support for your website maintenance. Post-website launch, they advise on necessary improvements and security updates. You can also discuss future improvements and additions to your online business. Advantages of Hiring Website Development Consultants What is the benefit of hiring a web development consultant? Several people ask this question. They think that hiring website developers and designers is adequate to succeed online. Remember, a successful online business requires a holistic approach. The web development consultancy provides a broader perspective on online business. Some benefits you can acquire from hiring a web development consultant include: Expert Advice Taking business online is not child’s play. You must have a deep understanding of the web development world. Website development consultants have years of experience in the industry and are aware of trends. Consequently, they help you understand things better and make smarter business decisions. Customized Solutions Every online business is unique in itself. You cannot rely on the strategies that worked for someone. Consultants provide you with tailored solutions for your unique businesses. They help you create a website that aligns perfectly with your business goals. Web consultants possess the knowledge and skills required for different areas of website development. Cost-Effective Some newbies may find hiring a web development consultant an additional expense. Nevertheless, it has numerous long-term benefits that outweigh its initial cost. A web consultant optimizes your website for better conversion, which naturally increases your revenue. Besides this, they optimize website design and layout that enhance the experience of your end users. They also ensure your website is optimized for search engines. These small things increase traffic to your website and ultimately your business grows. Let You Focus on Your Core Business Web development consultants take care of the overall growth of your online business. They plan strategies for your website and help you execute the right action at the right moment. You do not need to worry about what trend is going on and what tools you need to use. The consultant will guide you on everything. It allows your internal team to focus on their core competencies. Do not Wait for Years to Get Results If you are a beginner, learning things and growing online can take years. However, when you work with a web development consultant, you get faster results. They have tried and tested strategies to succeed online. Web development consultants have tools and experience that can help you get faster results. It saves your time as well, which is a valuable resource in online business. Knowledge Transfer Hiring consultants also transfer knowledge to your internal team. You and your team can learn from their experience and expertise. They provide you with knowledge that is useful for your future projects. Final Words: Should I Hire a Web Development Consultant in 2024? There are more than 200 factors that determine how your website will perform in search engines. Website speed, mobile responsiveness, search optimization, and various aspects of UI and UX are things you cannot compromise on. If you want to take your online business to the next level, you need to work on all these. And an experienced consultant can help you with that. Do not miss out on the opportunities. Partner with Almas to get professional web development consultancy. We will elevate your online presence and make sure your website aligns with the latest industry standards. So what are you waiting for? Consult with us and stay ahead of your competitors in 2024.
Vite 5.0: What is New in it?
On December 9, 2022, Vite 4.0 was released with numerous advancements. Within less than a year, this front-end tool has come up with its new version, i.e., Vite 5.0. Released on November 16, 2023, Vite 5.0 is all set to take front-end development to the next level. If you are wondering what is new in Vite 5.0, this blog post is for you. Overview of Vite For those who do not know, Vite is a renowned front-end web development tool. It helps users build and optimize web applications. Evan You is the key person behind the launch of this lightning-fast web development tool. It was first released in 2020, and since then, it has witnessed several upgrades. Let us learn about the changes we can see in its new version, which is Vite 5.0. Upgrades in Vite 5.0 Node.js Support With this new version, Vite 5.0 has started supporting the latest versions of Node.js. If you were working with previous versions of Node.js, this might disappoint you. Vite 5.0 does not support Note.js 14, 16, 17, and 19 anymore. You will be required to have Node.js 18/ 20+. Rollup 4 Vite 5.0 adopts Rollup 4, which brings various improvements in terms of performance. For instance, users can experience improvement in tree-shaking capabilities that naturally minimize the bundle size. Additionally, you can notice the following changes as well. The assertions prop is now named as attributes prop. You cannot use Acorn plugins anymore. For Vite plugins, this.resolve skipSelf option is now true by default. Deprecate CJS Node API Another crucial change you notice in Vite 5.0 is the deprecated CJS Node API. If you call require(‘vite’), it projects a deprecation warning. Users will need to update their frameworks or files to import the ESM build of Vite. Performance In Vite 5.0, you also get a new feature server.warmup. It improves the startup time several times. It enables users to define a list of modules that should be pre-transformed as soon as the server starts. When a user uses —open or server.open, Vite 5.0 warms up the entry point of their applications. Improved Type-Script Support TypeScript has turned into a crucial part of the JavaScript ecosystem. Vite 5.0 provides full support for this statically typed language. Now users can experience improved TypeScript integration. In addition to this, they can do better type-checking and get enhanced tooling support now. Worker. Plugins Acts as a Function Now In the previous version of Vite, worker.plugins used to accept an array of plugins ((Plugin | Plugin[ ])[ ]). However, in Vite 5.0, it has to be configured as a function that returns an array of plugins (() => (Plugin | Plugin[ ])[] ). It is an imperative change; therefore, parallel worker builds run steadily. Browser Compatibility Cross-browser compatibility is vital in the contemporary web development landscape. Vite 5.0 recognizes this need. This new version supports enhanced browser compatibility features. Users can do cross-browser testing without any issues now. It helps web developers build and test applications across different browser environments. Support for Manifest Files in .vite Directory Earlier the manifest files used to be generated in the root of build.outDir by default. With Vite 5, the user can produce them in the .vite directory in the build.outDir by default. This change aids in avoiding conflicts among public files having the same manifest file names during their transfer to the build.outDir. Developer Tooling Vite 5.0 has given more emphasis on improving the overall web development experience. Users can notice improvement in the errors handling capabilities. Developers can identify and resolve issues more quickly than before. In addition to this, Vite 5.0 streamlines the development workflow by adopting a productive coding environment. Press an Additional Enter for CLI Shortcuts Users using CLI shortcuts will need to press an additional Enter to prompt the shortcut command. For instance, earlier users had to press only r to restart the dev server. Now they will press r + Enter to restart the dev server. Conclusion Vite 5.0 introduces an array of new features while also eliminating several components. Some of the primary changes you can notice in this current version of Vite are improved TypeScript integration, Rollup 4, Cleaned up API, and Deprecated CJS Node API. It would not be wrong to mention that Vite is a next-generation front-end web development tool. This new version brings a lot of revolutionary changes and simplifies the developing experience.
TeamCity vs. Jenkins An In-depth Comparison
While several CI/CD tools are available, the two most preferred options are TeamCity and Jenkins. Both are powerful tools that help web developers streamline their workflow. Nevertheless, they differ in various aspects. This blog post highlights the differences between TeamCity vs. Jenkins based on several factors. Understanding these dissimilarities will help you choose the best option for your next project. So without any delay, let us get started. TeamCity vs. Jenkins: Overview What is TeamCity? Developed by JetBrains, TeamCity is a renowned continuous integration and delivery server system. It was first released in 2006. However, it has come a long way since then. The software enables users to relish flexible workflows, collaborate with other developers, and do unlimited development practices. This Java-based platform supports various programming languages and can integrate with Visual Studio, Eclipse, and more. What is Jenkins? Jenkins is a server-based, open-source CI/CD tool that allows users to build, test, and deploy web codes. It operates within servlet containers like Apache Tomcat. Jenkins was initially released on the 2nd of February 2011 by Kohsuke Kawaguchi. Jenkins operates in Java language. As a result, users can install it on UNIX, LINUX, and Windows. TeamCity vs. Jenkins: Comparison of Different Factors User-friendliness What’s the benefit of making a powerful software or tool that users can’t understand? Ease of use is one of the crucial factors to assess when choosing a CI/CD platform. You can’t leverage the platform if you cannot navigate through its interface. TeamCity features a clean web-based interface that simplifies navigation. Users often praise its straightforward setup and configuration. You get an easy-to-use dashboard with detailed build logs. In comparison to TeamCity, Jenkins can be a little difficult to navigate for beginners. However, overall it is good. The platform offers various customization options. It also supports custom CSS and Javascript files. Jenkins requires more configuration initially. Nevertheless, it won’t be that tough for you to understand it. Installation It is convenient to install TeamCity. Download the TeamCity server and read the documentation. It mentions all the instructions that you have to follow step-by-step. To install Jenkins, you need to have Java in your system. However, the installation is as smooth as that of TeamCity. As it is an open-source, you will set up the server and accomplish dependencies manually. Community Support Problem-solving approach, user engagement, and knowledge sharing are primary parts of an excellent community support system. TeamCity has community support available on its website. Users can contact their team with details of their issues. The support team might ask for information related to system or logs to fix the problem. Users can also share troubleshooting information for different issues in the knowledge base. Jenkins has the upper hand in terms of community support. Since it is an open-source platform, users share their troubleshooting experiences. Beginners can learn and resolve their issues from the experiences of previous customers. Scalability Scalability is one of the imperative considerations when deciding between TeamCity vs. Jenkins. TeamCity is capable of handling large-scale developments and deployments. Users get built-in support for distributed forms. TeamCity can distribute workload through different build agents. As a result, the platform can manage large projects efficiently. Jenkins won’t disappoint you in terms of scalability as well. With additional setup and configuration, Jenkins can manage large deployments and projects. You will have to set up distributed build agents to improve scalability. Moreover, you can also use external tools such as Kubernetes. Plugin Support TeamCity offers you almost all the basic required integrations. It has a wide range of built-in features for different technologies. For example, you can integrate it with the Visual Studio Team service. Jenkins is slightly better when it comes to integrations. You can choose from hundreds of free plugins based on your requirements. Key Integration Both platforms allow integration with different version control systems, such as Git, Mercurial, SVN, and more. TeamCity prioritizes native integration for a seamless developer experience. You can quickly integrate with JetBrains’ suite of IDEs. On the other hand, Jenkins is an open-source platform. As a result, it supports a broad range of integration with third-party tools. Security Security is another vital aspect you cannot compromise on. TeamCity supports integration with the Snyk security plugin. The plugin is capable of doing vulnerability scanning in the build pipeline. The plugin can identify and resolve various threats and risks. Jenkins also comes with various security features. Users can enable features like user authentication and more. Furthermore, Jenkins also allows integration with external authentication systems, such as LDAP, Active Directory, etc. Pricing TeamCity has three versions: TeamCity Professional, TeamCity Enterprise (from $1,999 per year), and TeamCity Cloud ( from $45 per month). Out of three, TeamCity Professional provides free access. You can even use it for commercial use. However, it comes with certain limitations. Note: Since the price keeps changing, visit the official website to check the current price. Jenkins is free to use as it is an open-source platform. You can download it and start using it. Conclusion: What Should I Choose? This comparison of TeamCity vs. Jenkins makes you aware of the ins and outs of both platforms. Now you can determine which one fulfills your needs better. Choosing between TeamCity and Jenkins depends on your specific requirements. If you are looking for user-friendly yet a robust CI/CD, go for TeamCity. On the other hand, users looking for extensive customization can choose Jenkins. However, you will have to spend more time on configurations and maintenance of this platform. Evaluate your priorities and make decisions accordingly.
MongoDB Sharding: Everything You Need to Know About it
Data sharding is the breakthrough technique of the modern data-driven era. It eliminates the limitation that a single database server can store and process only a certain amount of data. Data sharding enables users to store the data across different database servers. Therefore, it improves response time and supports scalability. This blog post gives you in-depth knowledge about MongoDB sharding. It also provides you guidance on setting up this sharding. MongoDB Overview Before we learn about MongoDB sharding, let’s get to know MongoDB. MongoDB is an open-source document-oriented NoSQL database. It has been used by several prominent companies, including Facebook, Google, and eBay. MongoDB lets users store data in flexible, JSON-like documents. Since this database features schema design, it can handle unstructured data. Consequently, it has become the first choice for most modern web applications. Unlike conventional relational database systems, MongoDB can manage a large amount of data. The best thing is that users can integrate MongoDB with all prominent programming languages, such as PHP, Python, Java, Node.js, C, C++, and more. What is MongoDB Sharding? Most companies use NoSQL databases to deal with storage and computing requirements of high-volume data. Sharding in MongoDB is a method that helps individuals distribute a database horizontally through different nodes. These nodes or servers are called “Shards”. Each shard can handle a portion of the data, creating a sharded cluster. It helps MongoDB manage the large volume of data and user concurrency efficiently. Each shard works as a unique database in a sharded cluster. They are accountable for storing and handling data. As soon as the data is added to the cluster, the balancer of MongoDB reallocates it across the shards. Thus it makes sure the workload is equally distributed. The architecture of sharding consists of the following elements: Shard Servers These servers are separate nodes within the sharded cluster. Each node collects a subset of the data and acts as an independent database. MongoDB circulates data across the shard servers to ensure even distribution. Config Servers These servers keep the metadata and configuration information for the sharded cluster. Query Routers Also referred to as “Mongos”, these routers work as the interface between the sharded cluster and applications. Query routers receive requests and queries to the suitable shards and combine results as required. As Mongos processes hide the underlying sharding complexity from the application, it looks like a single logical database. Shard key The shard key is a field that determines how data will be distributed in different shards. For even data distribution and efficient querying, it is necessary to choose the right shard key. Chunk A chunk constitutes a data range housed within a shard. It is decided by the shard key. Chunks are data migration units between shards. Balancer Balancer assures the uniform distribution of data amid the shards. Once data is added or eliminated, the balancer distributes data chunks between shards. Steps to Set up MongoDB Sharding You will require three servers to set up sharding in MongoDB. One for the config server and another for the Mongos instance. The last one is required for the shards. Here are step-by-step instructions to set up sharding in MongoDB. 1. Make a Directory Using Config Server First, you need to create a directory for the config server data. You can do this by running the below command on the 1st server. mkdir /data/configdb 2. Begin MongoDB in Config Mode Once you have created the directory, your next step will be starting MongoDB in config mode on the 1st server. Use this command in order to do it. mongod –configsvr –dbpath /data/configdb –port 27019 The command will begin the config server on port 27019 and store all the data in the /data/configdb directory. Note: We are employing the –configsvr flag to specify this server’s role as a config server. 3. Start Mongos Instance Next, start the process of Mongos instance. It will route queries to the accurate shards depending on the sharding key. Use the following command to begin this process. mongos –configdb <config server>:27019 Remember, you have to replace <config server> with the hostname/IP address of the machine where the config server is running. 4. Connect to Mongos Instance Use MongoDB shell to connect to Mongos instance. Below is the command to perform this. mongo –host <mongos-server> –port 27017 In the above command, replace <mongos-server> with the IP address or hostname of the server running the mongos instance. The command will open up the MongoDB shell and let you interact with Mongo’s instance, and add servers to the cluster. 5. Add Servers to Clusters Once you are connected to the mangos instance, add servers to the cluster. Use the following command: sh.addShard(“<shard-server>:27017”) In the above command, you need to replace <shard-server> with the hostname or IP address of the server running the shard. It will add the shard to the cluster so that it is available for utilization. Repeat this step for each shard you need to add to the cluster. 6. Permit Sharding for Database In the end, you need to enable sharding for a database. Here is the command for this process: sh.enableSharding(“<database>”) Replace <database> with the name of the database you want to shard. It will allow sharding for the particular database, enabling you to share its data across different shards. Congratulations! Now you have a fully functional MongoDB sharded cluster to handle high-traffic loads. Final Words Undoubtedly, MongoDB sharding is a robust technique supporting the horizontal scaling of databases. It allows a database to handle extensive data loads without compromising on performance. We hope this post gives you adequate information on MongoDB sharding. You can leverage the power of sharding and make the best use of your hardware resources.
GitHub Actions: An In-depth Guide for Beginners
Actions Platform? It would not be wrong to mention that GitHub Actions has significantly transformed the workflow of web developers. This Continuous Integration and Continuous Delivery (CI/CD) platform enables them to build, test, and deploy web codes straight from GitHub. Are you a beginner? Do you want to learn how this tool can boost your productivity? Read this guide until the end. It makes you aware of the components and features of GitHub Actions. Let’s get started! What is GitHub GitHub Actions is an automated tool powered by GitHub. It supports the automation of software building, testing, and deployment within the repositories of GitHub. Since the user does not need to leave GitHub, it naturally enhances the workflow and productivity. Developers can perform repetitive tasks while reducing manual intervention. GitHub Actions utilizes a YAML file to outline different steps of a workflow. These steps include running a script, testing, deploying codes, and sending notifications. Components of GitHub Actions GitHub Actions is a powerful tool that makes web development smooth and quick. Wondering what mechanisms make GitHub Actions work so well? Let’s learn about them. Workflow A workflow is a programmed process that runs one or more jobs. This configurable process is defined by a YAML file in the .github/workflows directory in a repository. This repository can have several workflows. And each workflow can perform a different set of jobs. For instance, you can use one workflow to create and test pull requests while another to deploy your application. Events An event is a particular activity in a repository. It is like a trigger for workflows. When events occur within a repository, GitHub Actions respond to them. These events can push requests, pull requests, or other actions. Jobs Jobs are a set of steps in a workflow. They are executed under the same runner. Each step is either a shell script or an action. Scripts execute while actions run. Action An action is an application for the GitHub Actions. It performs frequently repeated tasks. The application helps web developers to reduce the number of repetitive codes they write in their workflow files. Runner A runner is a server that runs workflows when they are triggered. One runner can perform a single task at a time. Essential Features of GitHub Actions Though GitHub Actions offers various advantages to web developers, a few prominent features are below. Variable in Workflows The default GitHub actions environment variables, incorporated in every workflow, run automatically. However, users can customize the environment variables by setting them in their YAML files. In the following example, you can see how one can create custom variables for POSTGRES_HOST and POSTGRES_PORT. These variables are available in the node client.js script. jobs: demo-job: steps: – name: Connect to your PostgreSQL run: node client.js env: POSTGRES_HOST: postres POSTGRES_PORT: 5432 Addition of Scripts to Workflow GitHub Actions allow the addition of scripts to workflow. You can employ actions for running scripts and shell commands. They get executed on the selected runner. Find out how an action can use the run keyword to execute npm install –g bats on the runner in the flowing example. jobs: demo-job: steps: – run: npm install -g bats Sharing Data Between Jobs One of the crucial features of GitHub Actions is that you can reuse the jobs you created earlier. You can save files for later use as artifacts on GitHub. These files get generated while building and testing web code. These files could be screenshots, binary, test results, and package files. You can also make your file and upload it on artifacts for later use. jobs: demo-job: name: Save output steps: – shell: bash run: | expr 1+1 > output.log – name: Upload output file users: actions/upload-artifact@v3 with: name: output-log-file path: output.log Step-by-Step Creation of GitHub Action File If you want to learn the workings of the GtiHub actions workflows, here is the step-by-step guide. You will need a GitHub repository to create the GitHub actions. Set up of the GitHub Action File ⦁ Make a .github/workflows directory in your repository on GitHub in case it does not already exist. ⦁ In the directory, you may create a file name: GitHub-actions-demo.yml. ⦁ Next, copy the following YAML content into the GitHub-actions-demo.yml file. name: GitHub Actions Example on: [push] jobs: Explore-GitHub-Actions: runs-on: ubuntu-latest steps: run: echo " The job was automatically triggered by a ${{Github.event_name }} event." run: echo " This job is now running on a ${{ runner.os }} server hosted by GitHub!" run: echo " The name of your branch is ${{ GitHub.ref }} and your repository is ${{ GitHub.repository }}." name: Check out repository code user: actions/checkout@v3 run: echo " The ${{ GitHub.repository }} repository has been cloned to the runner." run: echo " The workflow is now ready to test your code on the runner." name: List files in the repository run: | Is ${{ GitHub.workspace }} run: echo " This job's status is ${{ job.status }}." ⦁ Create a new branch for this commit and begin a pull request. ⦁ To create a pull request, click Propose new file. ⦁ When you commit your workflow file to a branch within your repository, it initiates the push event and then executes your workflow. Run the Files Your next step should be running the file. ⦁ Visit github.com and go to the main page of the repository. ⦁ Beneath your repository name, click Actions. ⦁ On the left sidebar, hit the workflow you want ⦁ Under Jobs, click on the Explore-GitHub-Actions job. The above log shows the breakdown of each step carried out. You can expand these steps to view its details. Conclusion GitHub Actions is a robust automation tool that streamlines development workflows. Web developers can leverage its flexibility, automation, and integration within GitHub. In addition to this, the platform supports event-driven workflows. In this blog, we learned about components of GitHub Actions. Also, we came to know about its essential features. All-in-all, GitHub Actions is a versatile tool for developers that simplifies the